Abstract
This study provides a comprehensive historical and econometric analysis of inflation in India from 1960 to the present, examining its key determinants, evolving trajectory, and future outlook. The research traces India's inflation through distinct macroeconomic epochs, highlighting a past characterised by extreme volatility driven by agricultural supply constraints, geopolitical energy shocks, and periods of fiscal dominance, which culminated in an inflationary peak of nearly 29% in 1974. An exploration of the theoretical debate between monetarist and structuralist paradigms concludes that Indian inflation is a complex hybrid phenomenon, shaped by monetary policy yet, in the short term, dominated by deep-seated supply-side bottlenecks, particularly in food and energy. The analysis identifies a critical inflation threshold of 5.5-6.0%, above which price increases become detrimental to long-term economic growth. A pivotal moment in this history was the 2016 adoption of a Flexible Inflation Targeting (FIT) framework, which successfully anchored expectations and moderated price increases, marking a significant structural break from the past. Using an AutoRegressive Integrated Moving Average (ARIMA) model, the study generates a statistical forecast which, reflecting historical inertia, projects a reversion towards a high long-term average. This result starkly contrasts with institutional forecasts that expect inflation to remain anchored at the 4% policy target, underscoring the profound impact of the FIT regime. The analysis concludes that while the modern monetary policy framework has fundamentally altered India's inflation dynamics, sustained price stability hinges on complementing central bank credibility with sustained fiscal discipline and aggressive supply-side reforms to address persistent structural vulnerabilities.
Keywords
Flexible Inflation Targeting (FIT), Monetarist vs Structuralist Debate, Supply-side Shocks, ARIMA Model,
Historical Analysis of Indian Inflation
1. Introduction to the Macroeconomics of Indian Inflation
Inflation remains one of the most critical, complex, and closely monitored macroeconomic indicators in the global economic framework, serving as a fundamental measure of overall economic stability, the population's purchasing power, and the effectiveness of national monetary policy. In the specific context of India—the world’s fourth-largest economy by purchasing power parity and a rapidly developing emerging market—the dynamics of inflation are particularly intricate. The Indian inflationary environment is influenced by a confluence of historical economic planning paradigms, deeply rooted structural supply-side constraints, significant vulnerability to global commodity price fluctuations, and an evolving monetary policy framework. For several decades, the Indian macroeconomy has been engaged in a delicate and often precarious dual mandate: fostering strong, accelerated economic growth to elevate hundreds of millions out of poverty, while simultaneously managing the destabilising and regressive effects of price volatility. This ongoing balancing act has shaped the macroeconomic discourse among policymakers, academic researchers, and international financial institutions
.
Historically, India’s inflation trajectory has exhibited considerable, and occasionally severe, volatility. This volatility has been predominantly influenced by domestic agricultural cycles governed by the monsoon, international exogenous shocks such as geopolitical oil embargoes, and periods characterised by substantial fiscal dominance, wherein monetary policy was subordinated to deficit financing. The economic narrative experienced a significant shift after 1991, following the systemic liberalisation of the Indian economy. This reform integrated domestic price levels more closely with global supply chains and international financial cycles, permanently transforming the transmission mechanisms of domestic inflation.
| [8] | Dheer, P., & Sharma, A. (2025, April). Tracing inflation trends in India: A historical and contemporary review. International Journal of Contemporary Research. Retrieved March 18, 2026, from https://doi.org/10.5281/zenodo.15256464 |
[8]
More recently, a fundamental paradigm shift took place in 2016 when the Reserve Bank of India (RBI) formally and legally adopted a Flexible Inflation Targeting (FIT) framework. This legislative amendment mandated a precise consumer price inflation target of 4 per cent, with a tolerance band of ±2 per cent.
This substantial transition marked a clear departure from the historical multiple-indicator approach and traditional monetary targeting, aligning India with contemporary, orthodox macroeconomic central banking practices
.
This research report offers a comprehensive, empirically grounded analysis of inflation in India from 1960 to the present, drawing on historical time-series data, macroeconomic literature, and advanced econometric methods. By applying the AutoRegressive Integrated Moving Average (ARIMA) model to annual consumer price index data from the World Bank API, and reviewing projections from the International Monetary Fund (IMF) and related scholarly work, the study identifies the main factors driving Indian inflation. It also thoroughly assesses the effectiveness of the Flexible Inflation Targeting regime, summarises the long-standing debate between structuralist and monetarist views on recent price trends, and provides a detailed econometric forecast of India's inflation outlook through the end of this decade.
2. Literature Review and Theoretical Paradigms
The academic literature concerning Indian inflation is extensive, characterised by vigorous debates regarding its primary determinants, the effectiveness of monetary policy transmission, and the optimal inflation threshold for a developing economy. A central theme in this literature concerns the tension between the monetarist and structuralist paradigms of inflation.
The monetarist view, based on classical macroeconomic theory, holds that inflation is primarily a monetary phenomenon driven by excess aggregate demand. In the Indian context, historical evidence consistently shows a strong, cause-and-effect link between the growth of the broad money supply (M3) and the overall price level.
During the period of fiscal dominance, which lasted from the late 1970s until the introduction of the Fiscal Responsibility and Budget Management (FRBM) Act in 2003, the RBI frequently monetised the central government's fiscal deficits. Empirical studies using Vector Error Correction Models (VECM) have indicated that during this period, increases in the primary fiscal deficit directly led to higher inflation and greater pressure on real interest rates, supporting monetarist concerns about unchecked public spending
.
In contrast, the structuralist paradigm contends that in developing economies such as India, inflation is not just a result of excess demand fuelled by monetary expansion, but also a natural consequence of structural rigidities and supply bottlenecks inherent in the development process. Structuralists highlight that the supply side of the Indian economy responds slowly to rising demand due to fragmented agricultural markets, poor logistics infrastructure, and heavy dependence on imported energy. Consequently, restrictive monetary policies aimed at reducing inflation can deprive the economy of essential credit, hindering natural growth without addressing the core supply issues
.
While monetarist models capture long-run nominal dynamics, they often fail to explain short-run inflation volatility in India, which is dominated by supply-side shocks.
This theoretical tension is thoroughly explored in the extensive body of work by former RBI Governor Dr C. Rangarajan. Dr Rangarajan’s research provides foundational insights into the relationship between money supply, economic output, and price behaviour in India. A critical contribution of this literature is the identification of "threshold inflation." While the conventional macroeconomic view acknowledges a short-term Phillips curve trade-off where mild inflation might stimulate output, persistently high inflation actively erodes allocative efficiency. Utilising cross-sectionally augmented distributed lag (CS-DL) approaches on state-level panel data, research indicates that the inflation threshold for India lies between 5.5 and 6.0 per cent. When inflation remains persistently elevated above this threshold, it generates profound macroeconomic uncertainty, distorts relative price signals, and imposes a severe drag on long-term private fixed investment and overall economic growth
.
This concept provides a critical reconciliation between monetarist and structuralist perspectives.
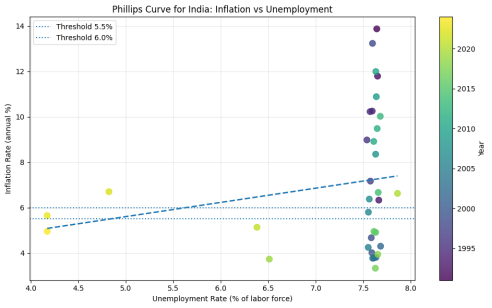
Figure 1. Empirical Phillips Curve for India Showing the Relationship Between Inflation and Unemployment, with Highlighted Threshold Inflation Band (5.5%–6.0%) Based on Rangarajan’s Framework.
The empirical Phillips curve for India, based on World Bank data, does not show a consistent inverse relationship between inflation and unemployment, challenging the typical short-term trade-off idea. Instead, the scatter plot indicates a weak link between the two variables and, at times, even a positive correlation, hinting at stagflation-like behaviour. This supports the structuralist view of Indian inflation, where supply-side factors primarily influence price changes rather than demand-side factors.
More importantly, empirical evidence appears consistent with Rangarajan's threshold inflation hypothesis. When inflation stays within the 5.5–6.0 per cent range, dispersion remains relatively contained, pointing to greater macroeconomic stability. Beyond this threshold, the link between inflation and unemployment becomes highly unstable and unpredictable. This shift indicates that high inflation hampers macroeconomic coordination, reduces the informational efficiency of prices, and destabilises output and employment fluctuations.
Instead of confirming a traditional Phillips curve trade-off, India's data suggest a non-linear, regime-dependent relationship. Moderate inflation can coexist with macroeconomic stability, but persistent high inflation undermines predictable economic behaviour. This evidence strengthens the theoretical and policy basis for India’s inflation-targeting framework, particularly the 6 per cent upper limit.
It should be noted that this analysis is based on annual macroeconomic data and is intended to provide indicative rather than causal inference consistent with existing empirical studies on emerging economies.
Furthermore, modern literature has heavily focused on the anatomy of inflation, specifically the divergence between core and headline metrics. Seminal research by Ball, Chari, and Mishra (2016) highlights that India's headline inflation is overwhelmingly dominated by extreme volatility in food and energy prices. Because the distribution of industry-level price changes in India is often right-skewed, isolated supply shocks can heavily distort the aggregate headline mean. Importantly, unlike in advanced economies where supply shocks represent temporary first-round effects, Indian supply shocks rapidly bleed into household inflation expectations, triggering secondary effects that elevate future core inflation and initiate self-sustaining inflationary spirals.
This specific vulnerability formed the academic rationale for the shift toward formal inflation targeting, a transition thoroughly evaluated by Eichengreen and Gupta, who note significant improvements in the anchoring of expectations post-2016, despite ongoing structuralist critiques
| [10] | Eichengreen, B., & Gupta, P. (2024, August). Inflation targeting in India: A further assessment. National Council of Applied Economic Research. Retrieved March 18, 2026, from
https://doi.org/10.1177/00252921241289522 |
[10]
.
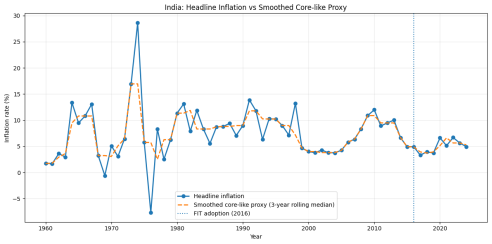
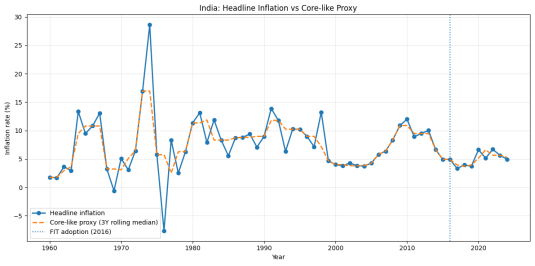
Figure 2. Headline Inflation vs Smoothed Core-like Proxy for India, Highlighting Volatility and Post-2016 Inflation Targeting Regime.
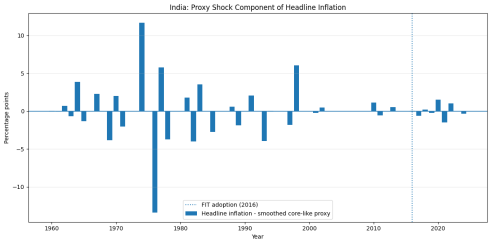
Figure 3. Proxy Shock Component of Headline Inflation in India, Showing Deviations from Underlying Trend and Post-2016 Regime.
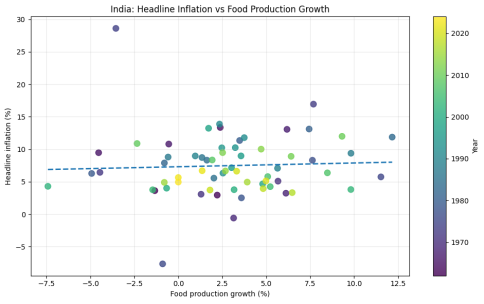
Figure 4. Headline Inflation vs Food Production Growth in India, Indicating Weak Supply-Side Relationship.
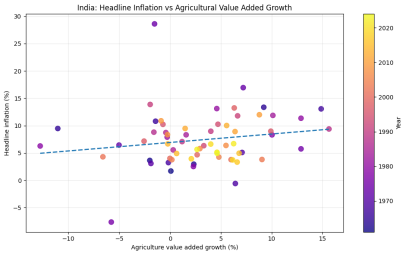
Figure 5. Headline Inflation vs Agricultural Value Added Growth in India, Showing Weak and Dispersed Relationship.
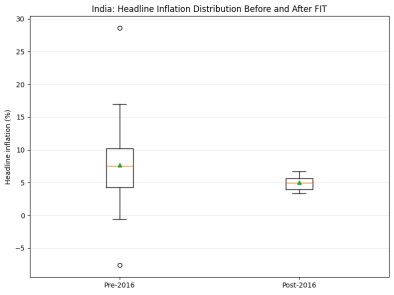
Figure 6. Distribution of Headline Inflation in India Before and After Inflation Targeting (2016), Showing Reduced Volatility.
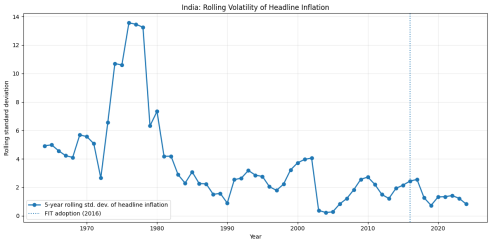
Figure 7. Rolling Volatility of Headline Inflation in India (5-Year Moving Standard Deviation), Illustrating High Instability in the 1970s–80s Followed by a Gradual Moderation and Improved Stability in the Post-2016 Inflation Targeting Regime.
Figures 2-7 visually support the literature on the structural characteristics of Indian inflation, particularly the distributional asymmetry in price changes.
Figure 2 illustrates the divergence between headline inflation and the smoothed proxy for underlying inflation, while
Figure 3 isolates the episodic shock component, highlighting the dominance of large, asymmetric supply disturbances.
Figures 4 and 5 further demonstrate the weak and dispersed relationship between inflation and aggregate supply indicators such as food production and agricultural value added, reinforcing the structuralist perspective. Finally,
Figures 6 and 7 show a clear reduction in dispersion and volatility in the post-2016 period, consistent with improved anchoring of inflation expectations under the Flexible Inflation Targeting regime. However, given the reliance on annual aggregate data and proxy constructions, these results should be interpreted as indicative stylised patterns rather than causal estimates. Disentangling the effects of institutional credibility from favourable global commodity conditions remains an important avenue for further empirical research.
Taken together, the reviewed literature and the accompanying empirical illustrations suggest that inflation in India is best understood not as a purely demand-driven monetary phenomenon, but as a structurally complex, regime-dependent process influenced by supply shocks, distributional asymmetries, and evolving policy credibility. The transition to Flexible Inflation Targeting represents not merely a change in policy instrument, but a shift in the underlying inflation regime—from one characterised by volatility and weak anchoring to one increasingly governed by expectations management and institutional credibility. However, the persistence of structural rigidities implies that monetary policy alone cannot fully stabilise inflation without complementary supply-side reforms.
These findings collectively suggest that inflation in India cannot be adequately explained by a single theoretical framework but instead requires a hybrid approach that incorporates monetary, structural, and expectations-based dynamics.
3. A Historical Anatomy of Indian Inflation (1960–2024)
Having established the theoretical and structural determinants of inflation in India, this section examines the long-run historical evolution of inflation dynamics using empirical time-series evidence.
The historical trajectory of inflation in India can be meticulously delineated into distinct macroeconomic epochs, each characterised by specific developmental philosophies, policy regimes, and profound exogenous shocks. Analysing empirical data from 1960 to 2024 provides a foundational understanding of the structural inertia and deeply embedded vulnerabilities inherent in the Indian economy. An analysis utilising the World Bank's annual consumer price inflation indicator (FP. CPI. TOTL. ZG) yields a dataset of 65 continuous observations spanning this period.
The summary statistics for this comprehensive 65-year dataset reveal a mean annual inflation rate of 7.3016 per cent and a median of 6.6234 per cent. The standard deviation is notably high at 4.8068 per cent, reflecting the wild historical oscillations between a minimum deflationary rate of -7.6339 per cent and an absolute maximum hyper-inflationary peak of 28.5987 per cent. These descriptive metrics underscore the persistent yet highly volatile nature of price increases over the Republic's long-term history.
3.1. The Pre-Liberalisation Era and Agricultural Constraints (1960s)
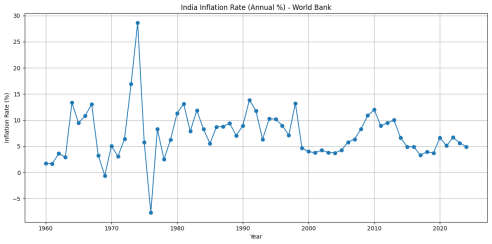
Figure 8. Historical trajectory of India’s CPI inflation (1960–2024), highlighting extreme volatility during the 1970s oil shocks—including the 1974 peak and 1976 deflation—followed by gradual moderation in inflation dynamics and improved stability around the 4% target in the post-inflation-targeting period.
During the 1960s, the Indian economy was defined by its commitment to self-reliance, import substitution, and heavy state-directed industrial planning. During this period, inflation was primarily driven by severe domestic supply-side constraints, most notably in the agricultural sector. While the decade saw the initiation of the Green Revolution aimed at fundamentally bolstering domestic food production, these technological interventions were insufficient to immediately offset the devastating impacts of climatic anomalies. The Indian agricultural sector’s near-total dependence on the monsoon resulted in catastrophic crop failures during the consecutive severe droughts of 1965-66 and 1966-67. Consequently, the annual inflation rate, which had registered at a highly stable 1.7798 per cent in 1960 and 1.6952 per cent in 1961, surged aggressively to 13.3552 per cent by 1964 as food scarcity permeated the broader economy.
| [8] | Dheer, P., & Sharma, A. (2025, April). Tracing inflation trends in India: A historical and contemporary review. International Journal of Contemporary Research. Retrieved March 18, 2026, from https://doi.org/10.5281/zenodo.15256464 |
[8]
Furthermore, the suspension of foreign aid by the United States and the World Bank during this period severely restricted India's ability to import essential commodities to temper domestic prices, exacerbating inflationary pressures
.
3.2. The Great Volatility: Oil Shocks and Stagflation (1970s)
The 1970s arguably marked the most economically turbulent and unstable decade in India’s macroeconomic history, largely driven by massive, unprecedented exogenous geopolitical crises. The defining event was the 1973 Organisation of Arab Petroleum Exporting Countries (OAPEC) oil embargo, which triggered a sudden and severe global energy crisis. Between 1973 and 1974, global crude oil prices effectively quadrupled. As a heavily import-dependent nation for its energy requirements, India was acutely vulnerable. The sudden exponential rise in fuel costs immediately catalysed a severe balance-of-payments crisis and imported cost-push inflation, systematically driving up transportation, logistics, and manufacturing expenses across the entire domestic supply chain
| [8] | Dheer, P., & Sharma, A. (2025, April). Tracing inflation trends in India: A historical and contemporary review. International Journal of Contemporary Research. Retrieved March 18, 2026, from https://doi.org/10.5281/zenodo.15256464 |
[8]
.
Compounded by a simultaneous failure of the domestic Kharif crop, the annual consumer price inflation rate skyrocketed, rising from 6.44 per cent in 1972 to 16.94 per cent in 1973, and eventually reaching an all-time high of 28.5987 per cent in 1974. In a desperate bid to combat this runaway hyperinflationary scenario, the central government enacted a series of draconian macroeconomic tightening measures. These included the mandatory freezing of wages and dearness allowances, the imposition of compulsory deposit schemes to drain liquidity from the public, and aggressive, stringent credit rationing by the central bank
| [8] | Dheer, P., & Sharma, A. (2025, April). Tracing inflation trends in India: A historical and contemporary review. International Journal of Contemporary Research. Retrieved March 18, 2026, from https://doi.org/10.5281/zenodo.15256464 |
[8]
.
This aggressive contractionary monetary and fiscal response, eventually coupled with a strong recovery in domestic agricultural output, led to a rapid and violent disinflationary spiral. The economy cooled so rapidly that by 1976, India plunged into deep deflation, with the annual inflation rate collapsing to a historic low of -7.6339 per cent. A subsequent, secondary oil shock triggered by the Iranian Revolution in 1979 pushed inflation back up into double digits by the end of the decade. This violent, whiplash-like oscillation between a peak of nearly 29 per cent and a trough of negative 7.6 per cent within a mere 24-month window perfectly encapsulates the extreme vulnerability of the closed Indian economy to exogenous structural supply shocks during that era
| [8] | Dheer, P., & Sharma, A. (2025, April). Tracing inflation trends in India: A historical and contemporary review. International Journal of Contemporary Research. Retrieved March 18, 2026, from https://doi.org/10.5281/zenodo.15256464 |
[8]
.
3.3. Post-Liberalisation, Global Integration, and the 2008 Crisis (1991–2015)
The severe balance of payments crisis of 1991 served as the ultimate catalyst for the sweeping economic liberalisation of India.
| [14] | Majumdar, P. (2025, September 25). The compulsion of 1991: How a balance of payments crisis forced India’s economic liberalisation. International Journal of Economics, Finance and Management Sciences. Retrieved March 18, 2026, from
https://doi.org/10.11648/j.ijefm.20251305.15 |
[14]
The systematic dismantling of the "License Raj," the reduction of prohibitive import tariffs, and the transition toward market-determined exchange rates fundamentally altered the nation's economic architecture. While liberalisation undeniably spurred a higher trajectory of real GDP growth and modernised the industrial base, it also intrinsically linked domestic price levels to the vast fluctuations of global commodity and financial cycles, importing a new vector of inflationary risk
| [8] | Dheer, P., & Sharma, A. (2025, April). Tracing inflation trends in India: A historical and contemporary review. International Journal of Contemporary Research. Retrieved March 18, 2026, from https://doi.org/10.5281/zenodo.15256464 |
[8]
.
During the late 1990s and early 2000s, inflation remained relatively moderate. However, the global financial crisis of 2008 precipitated a severe resurgence of inflationary pressure. Triggered by the collapse of Lehman Brothers, global central banks unleashed unprecedented liquidity, which inadvertently fuelled a massive surge in global commodity and food prices.
| [8] | Dheer, P., & Sharma, A. (2025, April). Tracing inflation trends in India: A historical and contemporary review. International Journal of Contemporary Research. Retrieved March 18, 2026, from https://doi.org/10.5281/zenodo.15256464 |
[8]
Domestically, the Indian government implemented large-scale expansionary fiscal stimulus packages to insulate the economy from the global recession.
The combination of global commodity price spikes, a depreciating rupee, and highly expansionary domestic fiscal policy created a perfect storm for inflation. Driven predominantly by soaring food prices—which form the largest component of the Indian consumption basket—inflation returned to punishing double digits, registering 8.35 per cent in 2008, 10.88 per cent in 2009, and ultimately peaking at 11.99 per cent in 2010.
| [8] | Dheer, P., & Sharma, A. (2025, April). Tracing inflation trends in India: A historical and contemporary review. International Journal of Contemporary Research. Retrieved March 18, 2026, from https://doi.org/10.5281/zenodo.15256464 |
[8]
This persistent, sticky inflation during the early 2010s heavily eroded purchasing power and severely tested the credibility of the RBI's multiple-indicator monetary policy framework, ultimately setting the stage for the transition to formal inflation targeting
.
4. Measurement Frameworks and Core vs. Headline Dynamics
The accurate and representative measurement of inflation is absolutely foundational to the execution of effective macroeconomic policy. For decades, both the Government of India and the Reserve Bank of India relied almost exclusively on the Wholesale Price Index (WPI) as the headline policy anchor and the primary measure of inflation. The WPI tracks changes in the prices of goods at the producer or wholesale level, with a heavy weight on manufactured products, basic metals, and bulk commodities.
However, as the Indian economy modernised and shifted toward a service-oriented model, the WPI proved increasingly inadequate for capturing the actual cost of living experienced by households. It entirely excluded the massive services sector (such as healthcare, education, and housing) and failed to account for the retail markups paid by end consumers
.
Recognising this profound structural flaw, particularly in the wake of the double-digit retail inflation of the early 2010s, the RBI constituted an Expert Committee under Dr Urjit Patel. Based on the committee's recommendations, the RBI formally shifted its nominal policy anchor from the WPI to the Consumer Price Index (Combined) in April 2014.
The CPI basket in India differs from that of advanced economies in that it assigns disproportionately large weights to basic sustenance. Specifically, the "Food and Beverages" category accounts for approximately 46 per cent of the total CPI basket.
| [4] | Bajaj, R. (2025, September 9). The inflation targeting regime in India: A critical assessment of outcomes and policy trade-offs. International Journal of Novel Research and Development. Retrieved March 18, 2026, from
https://ijnrd.org/papers/IJNRD2509152.pdf |
[4]
Consequently, the overall headline inflation rate in India is highly sensitive to minute fluctuations in agricultural prices
.
4.1. The Anatomy of Core Inflation and Skewness
Because headline inflation is so easily distorted by transient supply shocks to food and fuel, central bankers and academic researchers focus intensely on "core" inflation to gauge underlying, demand-driven price pressures. Core inflation systematically strips out the highly volatile food and energy components
.
Exhaustive research conducted by Ball, Chari, and Mishra (2016) provides deep insights into these dynamics by applying a specific methodology developed by the Federal Reserve Bank of Cleveland. Instead of merely excluding specific categories, they measured Indian core inflation by calculating the weighted median of price changes across all highly disaggregated industries. Their empirical findings demonstrate that headline inflation in India is substantially more volatile than core (median) inflation on a quarterly basis. Between 1994 and 2014, the average level of this median core inflation was approximately 3.4 per cent per year, whereas the average level of headline inflation was much higher at 5.6 per cent
.
This persistent divergence—a 2.2-percentage-point gap over two decades—occurs because the distribution of industry-level price changes in India is not normal; it is frequently and heavily right-skewed. A long statistical "tail" of specific industries experiencing massive, sudden price increases (most often related to food, raw materials, or energy) violently pulls the headline mean upward, while the median remains relatively insulated and stable
.
Crucially, in the Indian macroeconomic context, supply shocks to headline inflation do not merely dissipate as benign "first-round" effects. The literature establishes a strong, observable transmission mechanism where elevated headline inflation (driven by food or oil) feeds directly and persistently into household inflation expectations. Because food constitutes such a massive portion of household expenditure, sustained food inflation inevitably triggers demands for higher nominal wages. This dynamic leads to secondary effects that shift the long-term trend of core inflation upward. This phenomenon—reminiscent of the vicious, self-sustaining inflationary spirals witnessed in the United States and Europe during the 1970s—highlights the profound difficulty of managing monetary policy in an environment where basic subsistence necessities essentially dictate broader economic pricing behaviour
.
4.2. Proxy-Based Empirical Illustration of Core Inflation Divergence and Shock Asymmetry Using World Bank Data
While the preceding discussion establishes the theoretical distinction between headline and core inflation, direct measurement of core inflation from disaggregated price distributions is not readily available in long-run annual macroeconomic datasets, such as those provided by the World Bank. To address this limitation, this subsection presents a proxy-based empirical illustration that captures the divergence between headline inflation and its smoothed, trend-like component.
Figure 9. Headline inflation in India exhibits sharp, episodic spikes, while the 3-year rolling median proxy remains smoother, highlighting the divergence between volatile, shock-driven price movements and underlying inflation trends, with improved stability observed after the adoption of inflation targeting in 2016.
Figure 8 presents India’s annual headline inflation alongside a constructed core-like proxy derived from the same series.
The objective is not to replicate official measures of core inflation, but to provide a stylised empirical representation of the mechanisms highlighted in the literature—namely, the presence of asymmetric shocks and the tendency of headline inflation to deviate from its underlying trajectory.
The analysis employs annual consumer price inflation data for India obtained from the World Bank (indicator: FP. CPI. TOTL. ZG), covering the period from 1960 to the most recent available year. A core-like proxy for underlying inflation is constructed using a three-year rolling median of the headline inflation series.
The use of the rolling median serves two methodological purposes. First, it smooths short-term volatility, thereby approximating the persistent component of inflation that is less affected by transitory shocks. Second, and more importantly, it reduces the influence of extreme values, making it suitable for capturing the effects of right-skewed distributions in price changes, as emphasised in the literature.
The divergence between headline inflation and the smoothed median proxy can therefore be interpreted as an empirical proxy for shock-driven deviations, reflecting the impact of large, asymmetric supply disturbances—particularly those related to food and energy prices.
The analysis remains intentionally parsimonious and descriptive. Given the use of annual aggregate data and proxy constructions, the results are interpreted as indicative stylised patterns rather than causal estimates. Nevertheless, they provide a useful empirical bridge between theoretical insights on inflation asymmetry and observable long-run macroeconomic behaviour.
The visual evidence suggests a persistent and systematic divergence between headline inflation and the smoothed median proxy, particularly during periods of sharp inflation spikes such as the 1970s oil shocks and the late-2000s commodity surge. These deviations suggest that headline inflation in India is frequently driven by episodic, high-magnitude supply shocks rather than persistent demand-side pressures. The relative smoothness of the median-based proxy reinforces the argument that underlying inflation remains more stable than the headline series suggests, thereby providing empirical support for the skewness-based explanation of inflation dynamics proposed in the literature.
5. Macroeconomic Determinants and Structural Bottlenecks
The aetiology of Indian inflation is profoundly multifaceted, rooted in a complex, continuous interplay of monetary variables, fiscal dominance, and deep-seated structural supply constraints. An exhaustive review of the contemporary econometric literature identifies several key long-term determinants that drive the consumer price index
.
5.1. Monetary Expansion and the Legacy of Fiscal Dominance
From a classical monetarist perspective, the unchecked growth of the broad money supply (M3) has historically exhibited a strong, positive, and causal relationship with inflation in India.
This dynamic is inextricably linked to the historical concept of "fiscal dominance"—a scenario in which the monetary authority is effectively forced to accommodate the fiscal authority's profligacy
.
During the era of severe fiscal dominance, which academics largely define as the period between 1978 and 2003, the RBI frequently and directly monetised the central government's fiscal deficits. In practice, this meant the central bank expanded the monetary base to absorb government debt, injecting massive liquidity into the system without a corresponding increase in real economic output. Studies utilising Vector Error Correction Models (VECM) and Cholesky impulse responses have conclusively demonstrated that during this 1978–2003 window, expansions in the primary fiscal deficit directly translated into higher general price levels and forced upward pressure on real interest rates, validating the traditional post-Keynesian view of structural inflation in developing states. The formal enactment of the Fiscal Responsibility and Budget Management (FRBM) Act in 2003 represented a critical legislative milestone, systematically curtailing automatic deficit monetisation, lowering public debt trajectories, and finally granting the RBI a degree of vital operational autonomy over the money supply
.
5.2. Exogenous Supply Shocks and Infrastructure Rigidities
While monetary and fiscal variables provide the fundamental baseline for long-term inflationary trends, the extreme short- to medium-term volatility observed in the Indian CPI is overwhelmingly driven by structural factors and exogenous supply shocks
.
1) Agricultural Volatility and Administered Pricing: The Indian agricultural sector remains acutely dependent on the vagaries of the southwest monsoon. Deficient or uneven rainfall immediately correlates with severe food inflation. Beyond weather, deep structural issues perpetuate price instability: inadequate cold-storage infrastructure leading to massive post-harvest wastage, highly fragmented supply chains dominated by intermediaries, and inefficient logistics networks. Furthermore, the government's pervasive use of Minimum Support Prices (MSPs) to procure cereals often creates artificial price floors. While intended to protect farmers, aggressive annual hikes in MSPs inherently raise the baseline cost of agricultural commodities throughout the economy, creating inflationary pressure that is entirely immune to central bank interest-rate manipulation
| [8] | Dheer, P., & Sharma, A. (2025, April). Tracing inflation trends in India: A historical and contemporary review. International Journal of Contemporary Research. Retrieved March 18, 2026, from https://doi.org/10.5281/zenodo.15256464 |
[8]
.
2) Global Crude Oil and Exchange Rate Dynamics: As one of the world's largest energy consumers, India imports the vast majority of its domestic crude oil, making it highly exposed to international energy markets.
| [8] | Dheer, P., & Sharma, A. (2025, April). Tracing inflation trends in India: A historical and contemporary review. International Journal of Contemporary Research. Retrieved March 18, 2026, from https://doi.org/10.5281/zenodo.15256464 |
[8]
Global oil price fluctuations exert massive, immediate pressure on domestic inflation. This vulnerability is compounded by the Indian Rupee's exchange rate. A sudden depreciation of the Rupee against the US Dollar immediately inflates the domestic cost of imported crude. This triggers a cascading wave of cost-push inflation, systematically driving up transportation, logistics, fertiliser, and manufacturing costs across the domestic economy
.
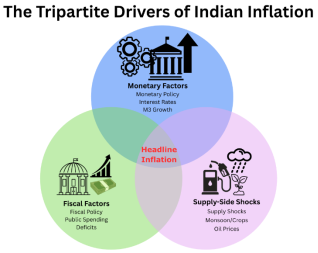
Figure 10. Conceptual framework illustrating the tripartite drivers of headline inflation in India—monetary factors (interest rates and money supply), fiscal factors (public spending and deficits), and supply-side shocks (food, energy, and monsoon variability)— whose dynamic interaction determines overall price levels.
6. Threshold Effects, The Sacrifice Ratio, and Growth Trade-Offs
The macroeconomic relationship between aggregate economic growth and inflation in India has been a subject of relentless econometric modelling and intense policy debate. Evaluated through the traditional lens of the New Keynesian Phillips Curve, research indicates a robust positive relationship between core inflation and the deviation of output from its long-run trend (the output gap). Consequently, to achieve systemic disinflation, the economy must inevitably endure a short-term loss in real output as monetary conditions tighten. The "Sacrifice Ratio"—a critical metric that defines the cumulative cost of reducing the inflation rate by one percentage point, expressed in terms of lost annualised output—is estimated in the academic literature to be approximately 2.7 for India.
This implies a substantial, tangible cost to the real economy whenever the RBI initiates a severe rate-hiking cycle to crush aggregate demand.
However, the long-term relationship between growth and inflation is decidedly non-linear. Extensive empirical research, most notably authored and championed by former RBI Governor Dr C. Rangarajan, explores the critical concept of "threshold inflation." While mild, predictable inflation may "grease the wheels" of a developing economy by facilitating relative wage adjustments and encouraging consumption, persistently elevated inflation above a specific physiological threshold is deeply detrimental to long-term growth
.
Advanced empirical estimations, specifically utilising heterogeneous panel techniques such as the cross-sectionally augmented distributed lag (CS-DL) approach on data spanning multiple Indian states, place this absolute inflation threshold for India precisely between 5.5 and 6.0 per cent. When the headline inflation rate remains above this critical upper boundary, it erodes long-term macroeconomic stability. It generates pervasive uncertainty regarding future purchasing power, heavily distorts relative price mechanisms, penalises unindexed savers, and fundamentally suppresses long-term private fixed capital formation. This rigorous empirical finding—that high inflation is an active enemy of growth, rather than a necessary byproduct of it—formed the fundamental, incontrovertible academic rationale for the establishment of a strict, numerical inflation-targeting regime
.
7. The Era of Flexible Inflation Targeting (2016–Present)
In direct response to the persistent, debilitating bouts of inflation in the early 2010s, and heavily influenced by the recommendations of the Urjit Patel Committee, the Government of India and the Reserve Bank of India fundamentally overhauled the nation's monetary architecture. The two entities signed the historic Monetary Policy Framework Agreement in 2015, which was subsequently codified into statutory law via an amendment to the RBI Act in May 2016. This marked the official, legal adoption of Flexible Inflation Targeting (FIT), explicitly prioritising price stability as the primary objective of monetary policy, while simultaneously mandating the RBI to keep in mind the objective of economic growth. The framework established a headline CPI target of 4.0 per cent, bound by an upper tolerance limit of 6.0 per cent and a lower limit of 2.0 per cent, thereby formalising the threshold theories into actionable policy
.
7.1. Efficacy, Transmission, and the Anchoring of Expectations
The prevailing academic consensus, supported by extensive econometric evaluations by institutions such as the World Bank and the IMF, largely acknowledges the profound operational success of the FIT regime.
Between the adoption of FIT in 2016 and the unprecedented onset of the global COVID-19 pandemic, the average rate of inflation in India moderated significantly when compared to the highly volatile preceding decade
| [10] | Eichengreen, B., & Gupta, P. (2024, August). Inflation targeting in India: A further assessment. National Council of Applied Economic Research. Retrieved March 18, 2026, from
https://doi.org/10.1177/00252921241289522 |
[10]
.
The most critical success metric of any inflation-targeting central bank is its ability to successfully anchor the forward-looking expectations of economic agents. Studies leveraging high-frequency survey data from professional economic forecasters and household sentiment indices indicate a marked, statistically significant decrease in the standard deviation of inflation forecasts in the post-2016 environment. Long-term inflation expectations became demonstrably less sensitive to short-term, transient price shocks (such as sudden global oil spikes or seasonal food shortages), strongly suggesting that markets had internalised and trusted the RBI's institutional commitment to the 4 per cent target
| [4] | Bajaj, R. (2025, September 9). The inflation targeting regime in India: A critical assessment of outcomes and policy trade-offs. International Journal of Novel Research and Development. Retrieved March 18, 2026, from
https://ijnrd.org/papers/IJNRD2509152.pdf |
[4]
.
Furthermore, rigorous empirical assessments contradict early, vocal criticisms that the strict legal mandate of FIT would force the RBI to become excessively hawkish and blind to growth. Analyses that adjust for the output gap and falling baseline inflation reveal that real policy rates became more accommodative following the transition. The central bank effectively utilised the "flexible" nature of its mandate to provide aggressive counter-cyclical smoothing during the severe economic shock of the COVID-19 pandemic, dropping rates and flooding the system with liquidity—a manoeuvre made possible precisely because long-term inflation expectations were securely anchored
| [11] | Eichengreen, B., Gupta, P., & Choudhary, R. (2021, January). Inflation targeting in India: An interim assessment. World Bank Group. Retrieved March 18, 2026, from
https://doi.org/10.1596/1813-9450-9422 |
[11]
.
7.2. The Structuralist Critique of Inflation Targeting
Despite these widely lauded achievements, the narrative that the FIT framework alone successfully tamed Indian inflation is heavily contested by structuralist macroeconomists. Critics argue that the substantial moderation in domestic inflation post-2016 serendipitously coincided with a prolonged, structural collapse in global commodity and international crude oil prices. An extensive econometric evaluation of the post-2016 period posits that the downward trajectory of domestic inflation is far better explained by these subdued, benign external supply shocks than by the psychological anchoring of expectations generated by the RBI's policy credibility
.
Furthermore, the structuralist critique relentlessly highlights the inherent limitations of conventional monetary policy in directly addressing India's primary driver of inflation: food. Because basic food demand is highly price-inelastic and its supply is rigidly governed by weather patterns and fragmented logistics, manipulating the RBI repo rate has virtually no effect on the transmission of changes in retail prices of agricultural commodities such as cereals, onions, or tomatoes.
Therefore, structuralists maintain that while the FIT framework provides a valuable and necessary nominal anchor, its ultimate long-term success remains dangerously tethered to the government's political will to implement deep, politically difficult supply-side agricultural, infrastructural, and land reforms. Without resolving these structural bottlenecks, the RBI will perpetually fight a rearguard action against inflation
.
8. Empirical Time-Series Modelling: The ARIMA Framework
To rigorously quantify historical mathematical patterns in the Indian economy and project the future trajectory of India's inflation, this study relies on advanced time-series econometrics, specifically employing the AutoRegressive Integrated Moving Average (ARIMA) methodology. ARIMA modelling is widely respected and extensively validated in modern macroeconomic literature for its superior, parsimonious ability to capture complex linear temporal dependencies, historical inertia, and short- to medium-term trends in highly volatile financial and economic series.
8.1. Methodology, Data Preprocessing, and Stationarity Diagnostics
The econometric analysis utilises annual consumer price inflation data (Indicator Code: FP. CPI. TOTL. ZG) extracted seamlessly via the World Bank API, specifically localised for India (IND). The preprocessing phase yields a robust, continuous dataset comprising 65 annual observations spanning strictly from 1960 to 2024.
The fundamental, non-negotiable assumption underlying the Box-Jenkins ARIMA approach is that the target time series must be stationary—meaning its statistical properties, specifically its mean, variance, and autocorrelation structure, remain constant over time and do not exhibit deterministic trends. To rigorously evaluate this prerequisite, the raw inflation series is subjected to two opposing, yet complementary, econometric diagnostics:
1) The Augmented Dickey-Fuller (ADF) Test: This test assesses the presence of a unit root, with the null hypothesis that the series is non-stationary. For the original raw inflation series, the calculated ADF statistic is -5.305134, with an associated p-value of 0.000005. Because the statistic is far more negative than the critical values at the 1% (-3.542), 5% (-2.910), and 10% (-2.592) levels, the test strongly rejects the null hypothesis, indicating stationarity.
2) The Kwiatkowski-Phillips-Schmidt-Shin (KPSS) Test: Conversely, the KPSS test is based on the null hypothesis that the series is trend-stationary. The calculated KPSS statistic for the original series is 0.116950, with a p-value of 0.10. Since the statistic is below the 5% critical value (0.463), the test fails to reject the null hypothesis, further corroborating the stationarity of the data.
Despite the original series showing robust evidence of level stationarity, macroeconomic modelling best practices often require differencing. Differencing serves to violently stabilise variance, remove subtle, hidden deterministic trends, and heavily penalise long-term drift. Consequently, the series undergoes first-order differencing (d = 1). The resulting first-differenced series yields an even stronger, highly significant ADF statistic of -6.595453 (p = 0.00000), confirming absolute, robust stationarity perfectly suited for autoregressive modelling.
Table 1. Results of ADF and KPSS stationarity tests for India’s inflation series, indicating that the data is stationary at this level and becomes strongly stationary after differencing.
Series State | ADF Statistic | ADF p-value | KPSS Statistic | KPSS p-value | Conclusion |
Level (Original) | -5.305134 | 0.000005 | 0.116950 | 0.100000 | Likely Stationary |
First Difference | -6.595453 | 0.000000 | 0.382803 | 0.084568 | Highly Stationary |
Second Difference | -6.026417 | 0.000000 | 0.111823 | 0.100000 | Highly Stationary |
While the ARIMA framework does not explicitly model structural breaks, the study addresses potential regime shifts—particularly the post-1991 liberalisation and the 2016 adoption of Flexible Inflation Targeting—through a comparative modelling approach. Specifically, separate specifications are estimated using the full historical sample (1960–2024) and a truncated post-liberalisation sample (1990–2024). This allows for an implicit assessment of structural change without imposing parametric break assumptions. More advanced approaches, such as structural break tests, regime-switching models, or ARIMAX specifications with exogenous variables, are acknowledged as valuable extensions but are beyond the scope of the present study, which focuses on parsimonious time-series inference and interpretability.
8.2. Model Identification and Parameter Selection
Following the confirmation of stationarity, the selection of the optimal autoregressive (p) and moving average (q) parameters is guided by the evaluation of the Auto-Correlation Function (ACF) and Partial Auto-Correlation Function (PACF) plots, and heavily penalised by the Akaike Information Criterion (AIC) and Bayesian Information Criterion (BIC), strictly adhering to the econometric principle of parsimony.
The analysis iteratively generates, evaluates, and rigorously compares two distinct candidate models to determine the optimal degree of integration:
1) ARIMA (1, 1, 1): Incorporating one autoregressive lag, first-order differencing, and one moving average lag.
2) ARIMA (1, 2, 1): Incorporating second-order differencing to heavily punish trend.
Table 2. Comparative evaluation of ARIMA model specifications, showing that ARIMA (1, 1, 1) provides a better fit than ARIMA (1, 2, 1) based on lower AIC, BIC, and HQIC values.
Evaluation Metric | ARIMA (1, 1, 1) | ARIMA (1, 2, 1) |
Log Likelihood | -163.297 | -171.253 |
Akaike Info Criterion (AIC) | 332.595 | 348.506 |
Bayesian Info Criterion (BIC) | 338.562 | 354.417 |
Hannan-Quinn (HQIC) | 334.896 | 350.779 |
The evaluation matrix strictly favours the ARIMA (1, 1, 1) model. It conclusively minimises information loss, as evidenced by the lowest AIC (332.595) and BIC (338.562) compared to the higher-differenced alternative.
Diagnostic testing of the selected ARIMA (1, 1, 1) model yields critical insights. The Ljung-Box test statistic (0.28, p = 0.60) indicates that the model residuals are independently distributed, with no significant remaining autocorrelation. This validates the model's structural integrity, demonstrating that it has successfully captured all linear signals in the data. However, a Jarque-Bera test probability of 0.00 indicates severe non-normality in the distribution of the residuals. This is an entirely expected and highly logical econometric outcome, given the extreme, unmodeled historical outliers (specifically the 1974 peak of 28.6% and the 1976 trough of -7.6%) that define the Indian inflation dataset.
9. Forecast Validation and Medium-Term Projections (2025–2030)
To establish and validate the predictive accuracy of the chosen model, the dataset is temporally split, intentionally withholding the final 10 years (2015–2024) as a blind, out-of-sample test set. The ARIMA (1, 1, 1) model is trained exclusively on data prior to 2015 and then forced to predict the subsequent decade.
9.1. Validation Metrics and Model Performance
The performance of the model on the 2015-2024 test set is rigorously quantified using standard forecast error metrics:
1) Mean Absolute Error (MAE): 2.6130
2) Root Mean Squared Error (RMSE): 2.8223
3) Mean Absolute Percentage Error (MAPE): 59.8489%
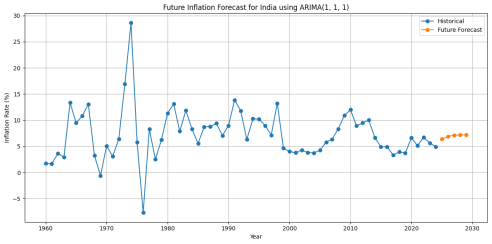
Figure 11. Historical and projected inflation rates for India using the ARIMA (1, 1, 1) model, showing a mean-reverting forecast with a gradual upward drift toward the long-term average, contrasting with the higher volatility observed in the historical series.
The relatively high MAPE (nearly 60 per cent) is a stark reflection of the inherent, well-documented difficulty of using pure linear autoregressive models to perfectly predict highly volatile, non-linear macroeconomic series that are frequently subjected to sudden, unpredictable exogenous supply shocks (such as the COVID-19 pandemic disruptions occurring within this exact test window). Because the ARIMA model is structurally blind to external variables such as oil prices or monsoon data, it relies heavily on historical inertia. Consequently, the model's forecast output (hovering consistently around 7.3 to 7.6 per cent during the test window) tends to smooth out short-term volatility, drawing heavily on the 65-year historical mean of 7.30 per cent. This results in a relatively flat, mean-reverting forecast curve compared to the much lower, volatile actual realised data (which hovered between 3.3 per cent and 6.6 per cent during this FIT-governed period).
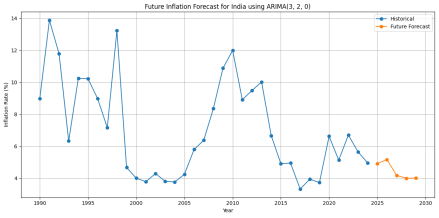
Figure 12. Historical and projected inflation rates for India using the ARIMA (3, 2, 0) estimated on post-1990 (1990-2024), showing a relatively stable mean-reverting forecast in the 4-5 per cent range, contrasting with the higher volatility observed in the historical series.
To further examine the sensitivity of the ARIMA-based inflation forecasts to the choice of historical window, an additional model was estimated using a truncated dataset covering the post-liberalisation period from 1990 to 2024. This specification intentionally excludes the extreme volatility of the pre-1990 era—particularly the structural shocks of the 1970s—and instead focuses on a more policy-relevant regime characterised by global integration, evolving monetary frameworks, and the eventual adoption of Flexible Inflation Targeting. The resulting forecast is presented in
Figure 12.
The alternative model produces a noticeably lower and more stable forecast trajectory, with inflation converging toward the 4–5 per cent range rather than reverting to the higher long-term historical mean. This contrast reinforces the presence of a structural break in India’s inflation dynamics, suggesting that models incorporating only the modern economic regime yield projections that are more aligned with the post-2016 policy environment, whereas full-sample models remain influenced by legacy volatility and historical inertia.
9.2. Reconciling Autoregressive Forecasts with Structural Change and Institutional Projections
The results from Section 9.1 reveal a critical methodological and macroeconomic insight: inflation forecasts for India are highly sensitive to the historical window used for estimation. The full-sample ARIMA model (1960–2024) produces a forecast that is strongly influenced by long-term historical inertia, projecting a gradual reversion toward the 7 per cent range. In contrast, the post-1990 specification generates a markedly lower and more stable trajectory, with inflation converging toward the 4–5 per cent band. This divergence is not merely statistical—it reflects a fundamental structural break in India’s inflation dynamics.
The key limitation of autoregressive models in this context lies in their inherently backwards-looking nature. By construction, ARIMA models assume temporal continuity, implicitly treating all historical regimes as equally informative for the future. However, India’s macroeconomic framework has undergone profound transformations—most notably the transition to a globally integrated economy post-1991 and the formal adoption of Flexible Inflation Targeting in 2016. These shifts have altered both the transmission mechanisms of inflation and the formation of expectations, rendering earlier high-volatility regimes less relevant for forward-looking projections.
The contrast between the two model specifications, therefore, provides an empirical illustration of regime dependence. The full-sample model captures the long-run statistical properties of inflation, including extreme episodes driven by oil shocks, fiscal dominance, and structural supply constraints. The truncated model, by excluding these legacy dynamics, aligns more closely with the contemporary policy environment, where inflation expectations are better anchored, and volatility is comparatively subdued.
This distinction becomes particularly significant when juxtaposed with institutional forecasts. Forward-looking projections from the IMF and the RBI consistently anticipate inflation stabilising around the 4 per cent target over the medium term. These projections explicitly incorporate policy credibility, improved monetary transmission, and structural reforms—factors absent from purely autoregressive frameworks. As a result, while the full-sample ARIMA forecast suggests a reversion to historical norms, the post-1990 model offers a trajectory that is more consistent with institutional expectations.
The divergence between these approaches underscores a broader methodological conclusion: in economies undergoing structural transformation, purely statistical time-series models must be interpreted with caution. Their outputs are best understood not as definitive forecasts, but as representations of embedded historical tendencies. In the Indian context, the coexistence of a high-inertia long-term signal and a lower, policy-anchored contemporary trajectory highlights the extent to which institutional credibility has reshaped inflation dynamics.
Ultimately, reconciling these forecasts suggests that the future path of inflation in India will depend on the persistence of the current policy regime. If the credibility of the Flexible Inflation Targeting framework is maintained and supported by fiscal discipline and supply-side reforms, inflation is likely to remain anchored near the 4–5 per cent range. However, in the absence of these conditions, historical forces identified by the full-sample model may reassert themselves, pulling inflation back toward its long-term average.
10. Conclusion
The evolution of inflation in India over the period 1960–2024 reflects a transition from a structurally constrained and highly volatile macroeconomic environment to a more stable, policy-anchored regime. Historical evidence highlights the dominant role of exogenous supply shocks, fiscal imbalances, and agricultural constraints in shaping inflation dynamics, particularly during the pre-liberalisation and high-volatility decades. The liberalisation of 1991 and the subsequent integration with global markets altered transmission mechanisms, while the adoption of Flexible Inflation Targeting (FIT) in 2016 represents a decisive structural break that has significantly improved the anchoring of inflation expectations.
The empirical analysis confirms that inflation in India cannot be fully explained by a single theoretical framework. Instead, it reflects a hybrid process driven by the interaction of monetary factors, structural bottlenecks, and expectation dynamics. The concept of threshold inflation provides an important bridge between these perspectives, suggesting that while moderate inflation may be consistent with macroeconomic stability, sustained inflation above the 5.5–6.0 per cent range is detrimental to long-term growth.
The time-series modelling results further reveal that inflation forecasts are highly sensitive to the choice of historical window. Models estimated on the full sample (1960–2024) produce forecasts that are influenced by long-term historical inertia, indicating a tendency toward higher average inflation. In contrast, models based on the post-1990 period generate lower and more stable projections, consistent with the contemporary policy regime. This divergence provides empirical evidence of regime dependence and reinforces the importance of structural change in shaping inflation dynamics.
The comparison between autoregressive forecasts and institutional projections highlights a fundamental distinction between backwards-looking statistical models and forward-looking policy-based expectations. While ARIMA models capture embedded historical tendencies, institutional forecasts incorporate policy credibility, structural reforms, and expectation anchoring. As such, statistical forecasts should be interpreted with caution in economies undergoing structural transformation.
Looking ahead, the trajectory of inflation in India will depend critically on the persistence and credibility of the current policy framework. If the Flexible Inflation Targeting regime continues to be supported by fiscal discipline and sustained supply-side reforms, inflation is likely to remain anchored within the 4–5 per cent range. However, the continued presence of structural rigidities—particularly in food supply chains and energy dependence—implies that inflationary pressures cannot be managed through monetary policy alone.
In conclusion, inflation in India is best understood as a regime-dependent, structurally complex phenomenon shaped by the interaction of historical inertia, policy credibility, and supply-side constraints. The post-2016 period marks a significant shift toward greater stability, but the long-term sustainability of this regime will depend on the alignment of monetary, fiscal, and structural policies.
Abbreviations
ACF | Auto-Correlation Function |
ADF | Augmented Dickey Fuller |
AIC | Akaike Information Criterion |
API | Application Programming Interface |
ARIMA | AutoRegressive Integrated Moving Average |
BIC | Bayesian Information Criterion |
CPI | Consumer Price Index |
CS-DL | Cross-Sectional Augmented Distributed Lag |
FIT | Flexible Inflation Targetting |
FRBM | Fiscal Responsibility and Budget Management |
HQIC | Hannan Quinn Information Criterion |
IMF | International Monetary Fund |
KPSS | Kwiatkowski-Phillips-Schmidt-Shin |
MAE | Mean Absolute Error |
MAPE | Mean Absolute Percentage Error |
MSP | Minimum Support Price |
OAPEC | Organisation of Arab Petroleum Exporting Countries |
PACF | Partial Auto-Correlation Function |
RBI | Reserve Bank of India |
RMSE | Root Mean Square Error |
VECM | Vector Error Correction Model |
WPI | Wholesale Price Index |
Author Contributions
Partha Majumdar: Conceptualisation, Data Curation, Formal Analysis, Methodology, Project Administration, Resources, Software, Validation, Visualisation, Writing – original draft, Writing – review and editing
Conflicts of Interest
The author declares no conflict of interest.
References
| [1] |
Agarwal, M., & Shah, I. A. (2019, August). Monetary policy: Effect on inflation and growth. Research and Information System for Developing Countries. Retrieved March 18, 2026, from
https://www.ris.org.in/sites/default/files/Publication/DP___239%20Manmohan%20Agarwal%20and%20Irfan%20Ahmed%20Shah_0.pdf
|
| [2] |
Ajit, Y., & Ghosh, T. (2024, July). A historical perspective on India’s inflation persistence: A quantile analysis. Indira Gandhi Institute of Development Research. Retrieved March 18, 2026, from
http://www.igidr.ac.in/pdf/publication/WP-2024-015.pdf
|
| [3] |
Al-Mashat, R. A. (2018, April 13). Chapter 11. India: Stabilizing inflation. IMF eLibrary. Retrieved March 18, 2026, from
https://www.elibrary.imf.org/display/book/9781484325940/ch011.xml
|
| [4] |
Bajaj, R. (2025, September 9). The inflation targeting regime in India: A critical assessment of outcomes and policy trade-offs. International Journal of Novel Research and Development. Retrieved March 18, 2026, from
https://ijnrd.org/papers/IJNRD2509152.pdf
|
| [5] |
Balakrishnan, P., & Parameswaran, M. (2022, June 27). What lowered inflation in India: Monetary policy or commodity prices? National Library of Medicine. Retrieved March 18, 2026, from
https://pmc.ncbi.nlm.nih.gov/articles/PMC9244015/
|
| [6] |
Ball, L., Chari, A., & Mishra, P. (2016, December). Understanding inflation in India. National Bureau of Economic Research. Retrieved March 18, 2026, from
https://www.nber.org/system/files/working_papers/w22948/w22948.pdf
|
| [7] |
Das, B., Baishya, U., & Baruah, B. (2024). Exploring the dynamics of inflation in India: A comprehensive empirical analysis (1981-2021). Society Register. Retrieved March 18, 2026, from
https://pressto.amu.edu.pl/index.php/sr/article/download/42199/36809/103837
|
| [8] |
Dheer, P., & Sharma, A. (2025, April). Tracing inflation trends in India: A historical and contemporary review. International Journal of Contemporary Research. Retrieved March 18, 2026, from
https://doi.org/10.5281/zenodo.15256464
|
| [9] |
Dua, P., & Goel, D. (2020, November 7). Determinants of inflation in India. The Journal of Developing Areas. Retrieved March 18, 2026, from
https://doi.org/10.1353/jda.2021.0040
|
| [10] |
Eichengreen, B., & Gupta, P. (2024, August). Inflation targeting in India: A further assessment. National Council of Applied Economic Research. Retrieved March 18, 2026, from
https://doi.org/10.1177/00252921241289522
|
| [11] |
Eichengreen, B., Gupta, P., & Choudhary, R. (2021, January). Inflation targeting in India: An interim assessment. World Bank Group. Retrieved March 18, 2026, from
https://doi.org/10.1596/1813-9450-9422
|
| [12] |
Kamila, A. (2022, June 9). Fiscal dominance in India: An empirical estimation. National Library of Medicine. Retrieved March 18, 2026, from
https://pmc.ncbi.nlm.nih.gov/articles/PMC9178225/
|
| [13] |
Kundurthi, R., & Kalluru, S. R. (2025, January 15). Inflation dynamics in India: A structural view. PSL Quarterly Review. Retrieved March 18, 2026, from
https://doi.org/10.13133/2037-3643/18448
|
| [14] |
Majumdar, P. (2025, September 25). The compulsion of 1991: How a balance of payments crisis forced India’s economic liberalisation. International Journal of Economics, Finance and Management Sciences. Retrieved March 18, 2026, from
https://doi.org/10.11648/j.ijefm.20251305.15
|
| [15] |
Mohaddes, K. (2016, February 25). Chapter 5. Does inflation slow long-term growth in India? IMF eLibrary. Retrieved March 18, 2026, from
https://www.elibrary.imf.org/display/book/9781513541259/ch005.xml
|
| [16] |
Nell, K. S. (2023, September). Inflation and growth in developing economies. Universidad Nacional AutóNoma de MéXico. Retrieved March 18, 2026, from
https://www.redalyc.org/journal/601/60179530003/60179530003.pdf
|
| [17] |
Pandey, R., Patnaik, I., & Sengupta, R. (2024, October). The journey of inflation targeting in India. Indira Gandhi Institute of Development Research. Retrieved March 18, 2026, from
http://www.igidr.ac.in/pdf/publication/WP-2024-022.pdf
|
| [18] |
Salian, P. V., & Gopakumar, K. (n.d.). Inflation and economic growth in India – an empirical analysis. Indira Gandhi Institute of Development Research. Retrieved March 18, 2026, from
http://www.igidr.ac.in/conf/money/mfc-13/Inflation%20and%20Economic%20Growth%20in%20India_Prasanna%20and%20Gopakumar_IGDIR.pdf
|
| [19] |
Saxena, S. (2021, May). Inflationary trends in India (1969–2019). International Journal of Policy Sciences and Law. Retrieved March 18, 2026, from
https://ijpsl.in/wp-content/uploads/2021/05/Inflationary-Trends-in-India-1969-2019_Sanya-Saxena.pdf
|
| [20] |
Saxena, S. P., & Singh, A. (2015). Determinants of inflation in India: An econometric analysis. Scholedge International Journal of Management and Development. Retrieved March 18, 2026, from
https://thescholedge.org/index.php/sijmd/article/view/210/318
|
Cite This Article
-
APA Style
Majumdar, P. (2026). Tracing the Trajectory, Determinants, and Forecasts of Inflation in India: A Comprehensive Econometric and Historical Analysis. International Journal of Business and Economics Research, 15(2), 42-57. https://doi.org/10.11648/j.ijber.20261502.13
 Copy
|
Copy
|
 Download
ACS Style
Majumdar, P. Tracing the Trajectory, Determinants, and Forecasts of Inflation in India: A Comprehensive Econometric and Historical Analysis. Int. J. Bus. Econ. Res. 2026, 15(2), 42-57. doi: 10.11648/j.ijber.20261502.13
Copy
|
Download
AMA Style
Majumdar P. Tracing the Trajectory, Determinants, and Forecasts of Inflation in India: A Comprehensive Econometric and Historical Analysis. Int J Bus Econ Res. 2026;15(2):42-57. doi: 10.11648/j.ijber.20261502.13
Copy
|
Download
-
@article{10.11648/j.ijber.20261502.13,
  author = {Partha Majumdar},
  title = {Tracing the Trajectory, Determinants, and Forecasts of Inflation in India: A Comprehensive Econometric and Historical Analysis},
  journal = {International Journal of Business and Economics Research},
  volume = {15},
  number = {2},
  pages = {42-57},
  doi = {10.11648/j.ijber.20261502.13},
  url = {https://doi.org/10.11648/j.ijber.20261502.13},
  eprint = {https://article.sciencepublishinggroup.com/pdf/10.11648.j.ijber.20261502.13},
  abstract = {This study provides a comprehensive historical and econometric analysis of inflation in India from 1960 to the present, examining its key determinants, evolving trajectory, and future outlook. The research traces India's inflation through distinct macroeconomic epochs, highlighting a past characterised by extreme volatility driven by agricultural supply constraints, geopolitical energy shocks, and periods of fiscal dominance, which culminated in an inflationary peak of nearly 29% in 1974. An exploration of the theoretical debate between monetarist and structuralist paradigms concludes that Indian inflation is a complex hybrid phenomenon, shaped by monetary policy yet, in the short term, dominated by deep-seated supply-side bottlenecks, particularly in food and energy. The analysis identifies a critical inflation threshold of 5.5-6.0%, above which price increases become detrimental to long-term economic growth. A pivotal moment in this history was the 2016 adoption of a Flexible Inflation Targeting (FIT) framework, which successfully anchored expectations and moderated price increases, marking a significant structural break from the past. Using an AutoRegressive Integrated Moving Average (ARIMA) model, the study generates a statistical forecast which, reflecting historical inertia, projects a reversion towards a high long-term average. This result starkly contrasts with institutional forecasts that expect inflation to remain anchored at the 4% policy target, underscoring the profound impact of the FIT regime. The analysis concludes that while the modern monetary policy framework has fundamentally altered India's inflation dynamics, sustained price stability hinges on complementing central bank credibility with sustained fiscal discipline and aggressive supply-side reforms to address persistent structural vulnerabilities.},
 year = {2026}
}
Copy
|
Download
-
TY  - JOUR
T1  - Tracing the Trajectory, Determinants, and Forecasts of Inflation in India: A Comprehensive Econometric and Historical Analysis
AU  - Partha Majumdar
Y1  - 2026/04/13
PY  - 2026
N1  - https://doi.org/10.11648/j.ijber.20261502.13
DO  - 10.11648/j.ijber.20261502.13
T2  - International Journal of Business and Economics Research
JF  - International Journal of Business and Economics Research
JO  - International Journal of Business and Economics Research
SP  - 42
EP  - 57
PB  - Science Publishing Group
SN  - 2328-756X
UR  - https://doi.org/10.11648/j.ijber.20261502.13
AB  - This study provides a comprehensive historical and econometric analysis of inflation in India from 1960 to the present, examining its key determinants, evolving trajectory, and future outlook. The research traces India's inflation through distinct macroeconomic epochs, highlighting a past characterised by extreme volatility driven by agricultural supply constraints, geopolitical energy shocks, and periods of fiscal dominance, which culminated in an inflationary peak of nearly 29% in 1974. An exploration of the theoretical debate between monetarist and structuralist paradigms concludes that Indian inflation is a complex hybrid phenomenon, shaped by monetary policy yet, in the short term, dominated by deep-seated supply-side bottlenecks, particularly in food and energy. The analysis identifies a critical inflation threshold of 5.5-6.0%, above which price increases become detrimental to long-term economic growth. A pivotal moment in this history was the 2016 adoption of a Flexible Inflation Targeting (FIT) framework, which successfully anchored expectations and moderated price increases, marking a significant structural break from the past. Using an AutoRegressive Integrated Moving Average (ARIMA) model, the study generates a statistical forecast which, reflecting historical inertia, projects a reversion towards a high long-term average. This result starkly contrasts with institutional forecasts that expect inflation to remain anchored at the 4% policy target, underscoring the profound impact of the FIT regime. The analysis concludes that while the modern monetary policy framework has fundamentally altered India's inflation dynamics, sustained price stability hinges on complementing central bank credibility with sustained fiscal discipline and aggressive supply-side reforms to address persistent structural vulnerabilities.
VL  - 15
IS  - 2
ER  -
Copy
|
Download